
Dashboard
The analytics view of your organization's security posture over time.
/dashboard is where you land by default — a real-time view of posture across every scope, not
just a single run.
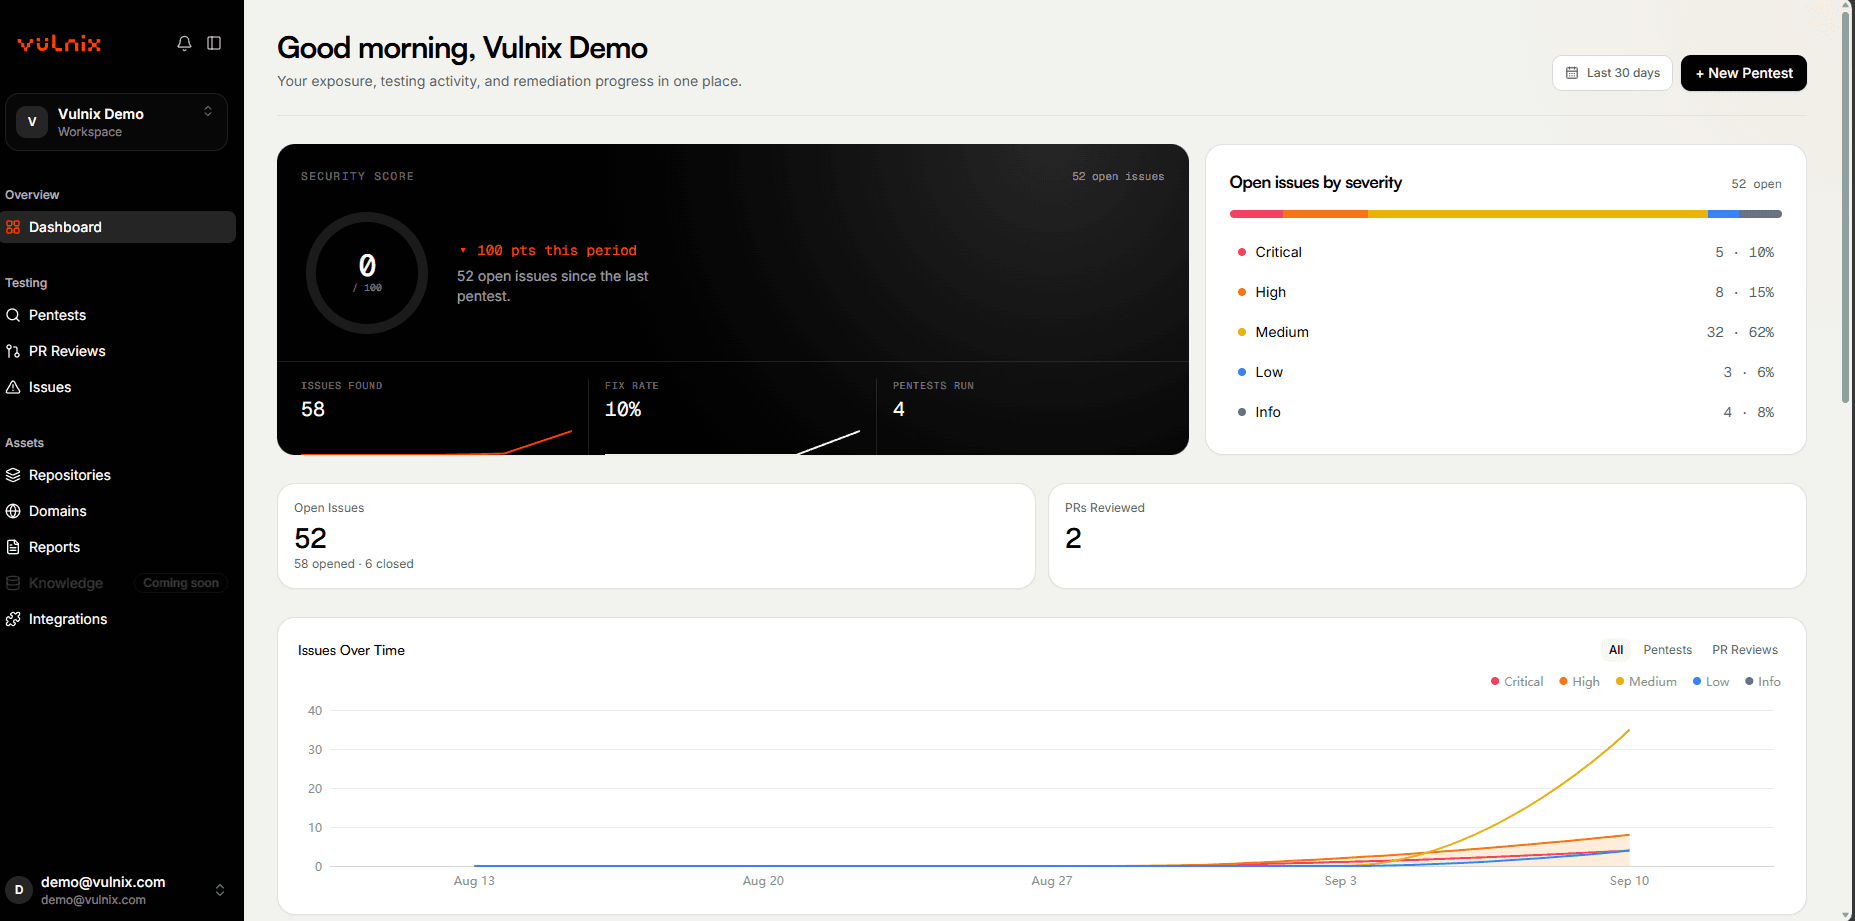
What's on it
Prop
Type
Time range
Every chart responds to the same range control, so you're always comparing the same window across widgets rather than reconciling mismatched date ranges by hand.
Trial organizations
Full detail on critical/high findings requires a paid plan
On a trial organization, a critical or high severity entry in Top Issues or the exploitability list shows its severity and status, but the title and CVE are shown as a redacted placeholder rather than the real value — this is intentional gating, not a rendering issue. Every other widget, and every medium/low/info finding, is shown in full regardless of plan.


